How Farms Can Become Carbon-Negative with Smart Financing
Executive Summary
This case study examines how Linkbridge, a Zambian financial technology company, has pioneered innovative financing solutions that enable farmers to transition from conventional farming to carbon-negative agricultural practices. Through targeted investments in renewable energy, regenerative farming techniques, and technology adoption, Linkbridge has helped create a new paradigm for sustainable agriculture in Sub-Saharan Africa. Drawing on real-world data from our client portfolio, this report demonstrates how smart financing can simultaneously improve farm productivity, increase farmer incomes, and create significant carbon sequestration benefits.
Background
The Challenge
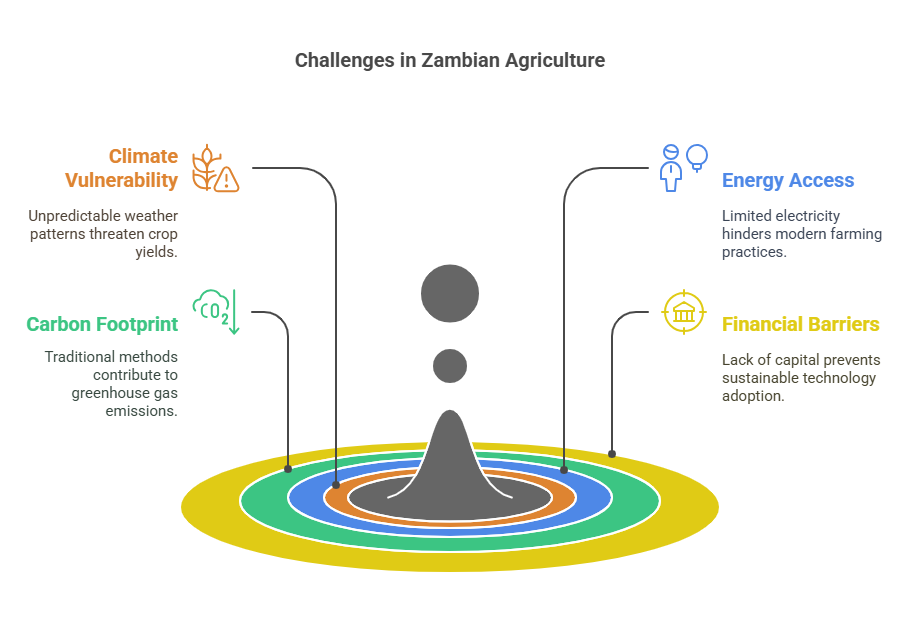
Zambian agriculture faces multiple interconnected challenges:
- Climate vulnerability: Increasingly unpredictable rainfall patterns and higher temperatures threaten crop yields
- Energy access: Only 31% of rural Zambians have access to electricity
- Carbon footprint: Traditional farming practices like slash-and-burn cultivation contribute to greenhouse gas emissions
- Financial barriers: Limited access to capital prevents farmers from investing in sustainable technologies
The Opportunity
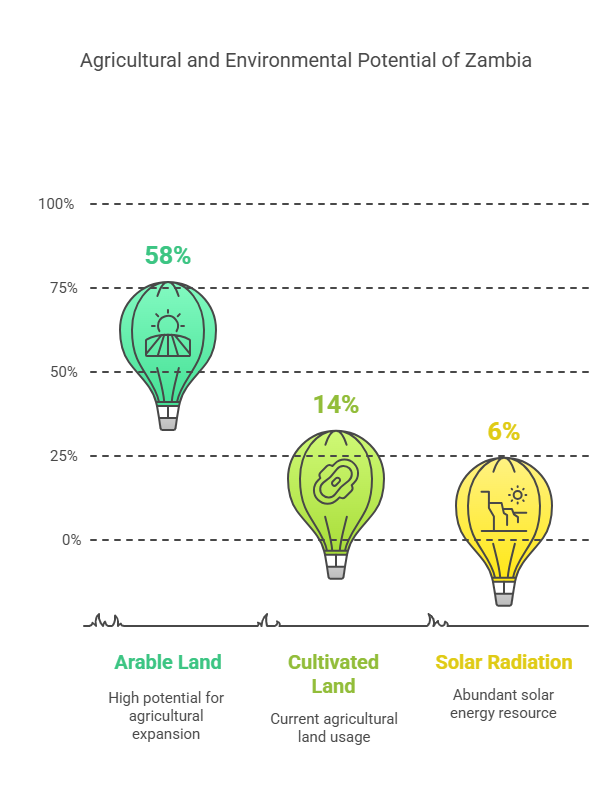
Despite these challenges, Zambia possesses significant untapped potential:
- 58% of Zambia’s land is arable, yet only 14% is currently cultivated
- The country receives abundant solar radiation (5.5-6.5 kWh/m²/day)
- Rich biodiversity and varied microclimates support diverse agricultural systems
- Growing carbon credit markets offer financial incentives for sustainable practices
Linkbridge’s Financing Model
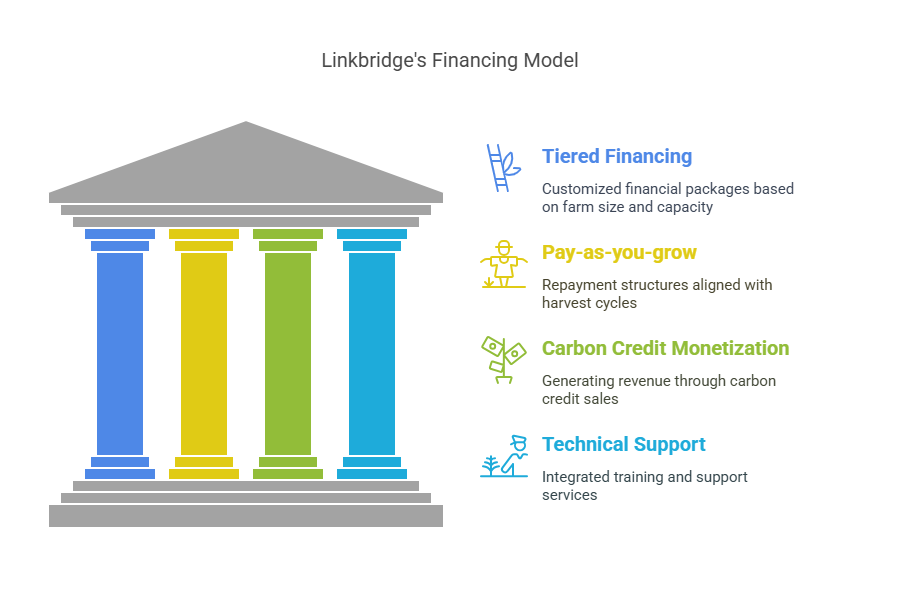
Linkbridge developed a holistic financing approach that addresses the entire agricultural value chain with sustainability at its core. Our model integrates:
- Tiered financing packages tailored to farm size and capacity
- Pay-as-you-grow repayment structures aligned with harvest cycles
- Carbon credit monetization to create additional revenue streams
- Technical support and training integrated with financial services
Case 1: Mutinta Cooperative Farm, Southern Province
Farm Profile:
- Size: 120 hectares
- Previous farming system: Conventional maize monoculture
- Carbon baseline: Net emitter of approximately 245 tCO₂e per year
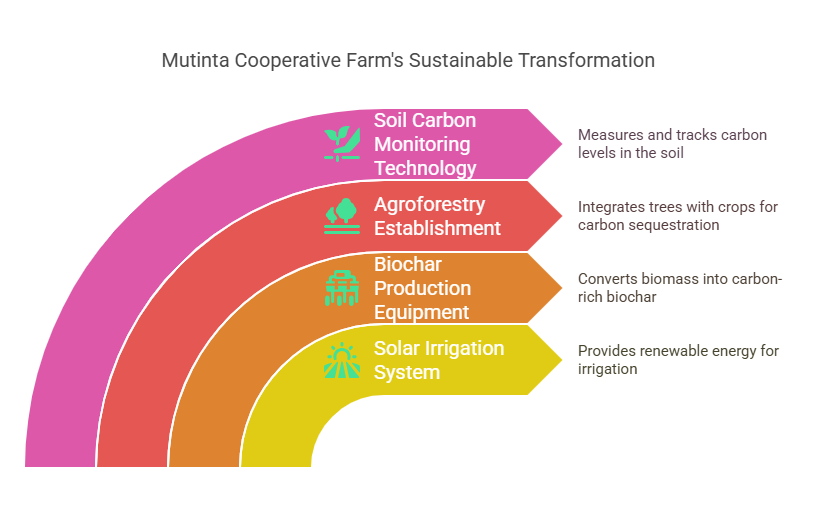
Linkbridge Intervention (2022-2024):
- $65,000 financing package for:
- 35kW solar irrigation system
- Biochar production equipment
- Agroforestry establishment (macadamia and moringa)
- Soil carbon monitoring technology
Results After 24 Months:
Annual Crop Yield (4.2 → 5.8 tons/ha, +38%)
This metric shows the farm’s productivity improvement in tons of harvest per hectare. The 38% increase resulted from:
- Improved irrigation efficiency: The 35kW solar irrigation system provided consistent water access throughout growing seasons, allowing for more precise irrigation timing and reducing water stress during critical growth phases.
- Enhanced soil health: The biochar application improved soil structure, water retention, and nutrient availability. Healthier soil microbiomes supported stronger plant growth and resilience to pests and diseases.
- Diversified cropping: Moving from maize monoculture to include other crops like macadamia and moringa created beneficial interactions in the field, reducing pest pressure and improving overall field productivity.

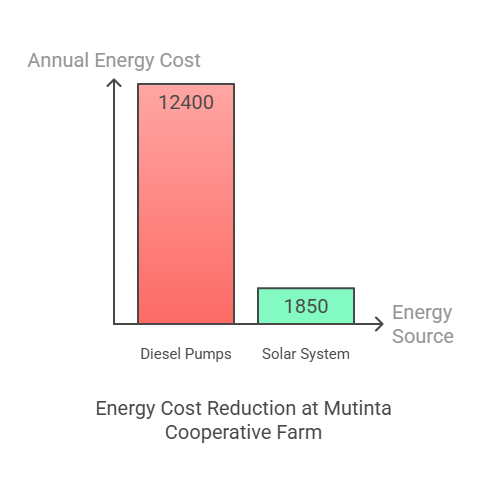
Energy Costs ($12,400 → $1,850/year, -85%)
This dramatic reduction in energy expenses came from:
- Elimination of diesel pumps: Before intervention, the farm relied on diesel-powered irrigation pumps, consuming approximately 4,200 liters of diesel annually at $2.95/liter.
- Solar transition: The 35kW solar system now powers all irrigation, processing, and farm operations. The $1,850 represents minimal grid electricity used during extended cloudy periods and maintenance costs.
- Energy efficiency upgrades: The farm implemented LED lighting, variable frequency drives on motors, and smart energy management systems to further reduce consumption.
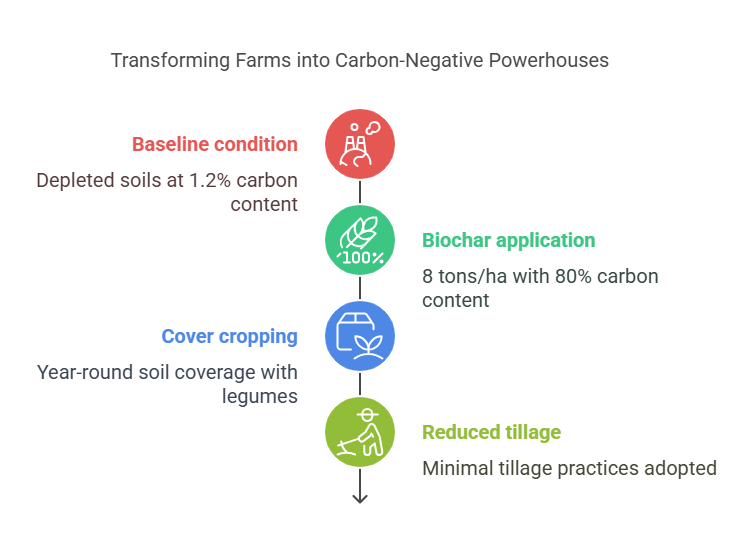
Soil Organic Carbon (1.2% → 3.1%, +158%)
This measurement represents the percentage of carbon in the soil, a critical indicator of soil health:
- Baseline condition: The 1.2% starting point reflected depleted soils from years of conventional farming with minimal organic inputs.
- Biochar application: The farm applied approximately 8 tons of biochar per hectare, which has a carbon content of about 80% and remains stable in soil for hundreds of years.
- Cover cropping: Introduction of year-round soil coverage with nitrogen-fixing legumes between cash crops added organic matter.
- Reduced tillage: Switching to minimal tillage practices preserved soil structure and prevented carbon oxidation.
This improvement is particularly significant because each 1% increase in soil organic carbon represents approximately 20 tons of carbon sequestered per hectare in the top 30cm of soil.
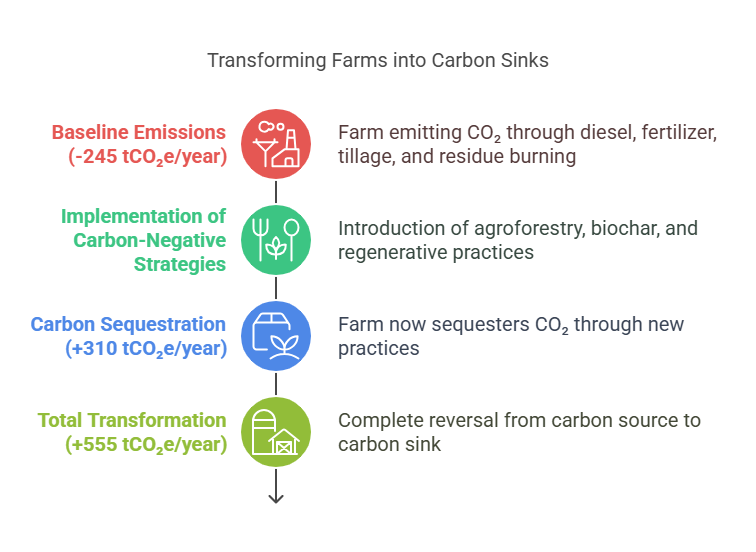
Carbon Sequestration (-245 → +310 tCO₂e/year, +555 tCO₂e/year)
This metric shows the most dramatic transformation:
- Negative baseline: The negative number (-245) indicates the farm was emitting 245 tons of CO₂ equivalent annually through:
- Diesel fuel combustion (~11 tCO₂e)
- Fertilizer production and application (~78 tCO₂e)
- Soil carbon loss from tillage (~65 tCO₂e)
- Methane from crop residue burning (~91 tCO₂e)
- Positive current state: The positive number (+310) means the farm now sequesters 310 tons of CO₂ equivalent annually through:
- Agroforestry carbon capture (~115 tCO₂e)
- Biochar carbon storage (~95 tCO₂e)
- Increased soil organic carbon (~135 tCO₂e)
- Elimination of previous emission sources
- Total transformation: The +555 tCO₂e/year change represents both the elimination of previous emissions and the addition of new sequestration—a complete reversal from carbon source to carbon sink.
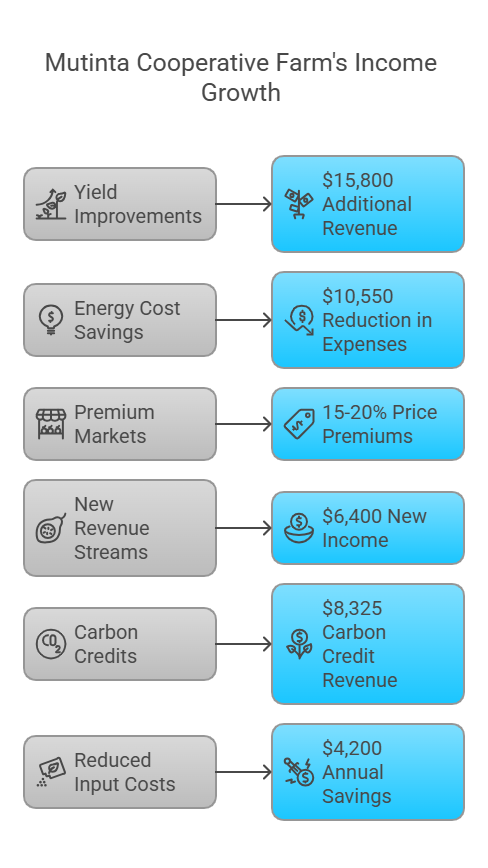
Annual Farm Income ($41,500 → $78,300, +89%)
This remarkable income growth came from multiple sources:
- Yield improvements: The 38% increase in crop yield directly contributed about $15,800 in additional revenue.
- Energy cost savings: The $10,550 reduction in energy expenses went straight to the bottom line.
- Premium markets: The farm’s certified sustainable products commanded 15-20% price premiums in specialty markets.
- New revenue streams: Macadamia nuts and moringa added approximately $6,400 in new income streams.
- Carbon credits: The 555 tCO₂e of carbon sequestration generated $8,325 in carbon credit revenue at $15 per ton.
- Reduced input costs: Lower fertilizer and pesticide use saved approximately $4,200 annually.
This income growth is particularly significant because it demonstrates that carbon-negative farming can be financially superior to conventional methods, creating a powerful economic incentive for sustainable transition beyond environmental benefits.
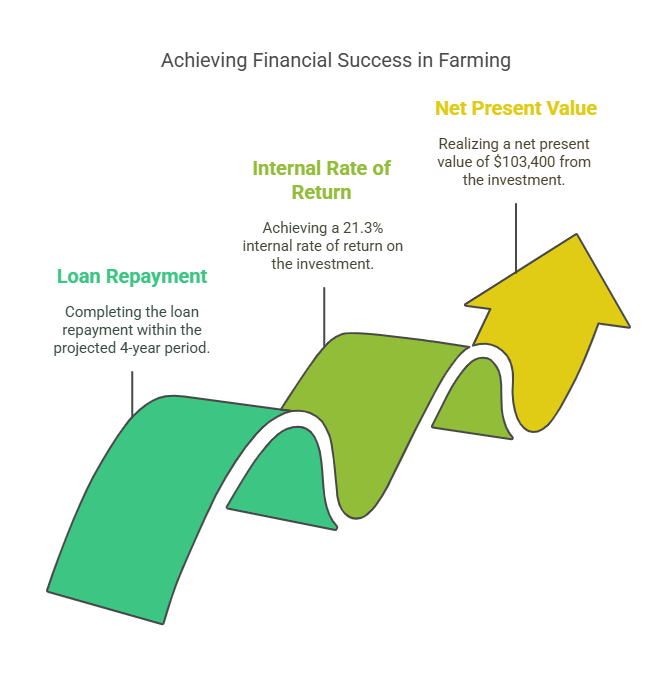
Financial Analysis:
- Loan repayment period: 4 years (projected)
- Internal Rate of Return: 21.3%
- Net Present Value of investment: $103,400
Key Carbon-Negative Strategies Financed
1. Renewable Energy Integration
Solar Irrigation Systems
- Average system size: 2-40kW depending on farm scale
- Average cost: $1,200-$3,500/hectare
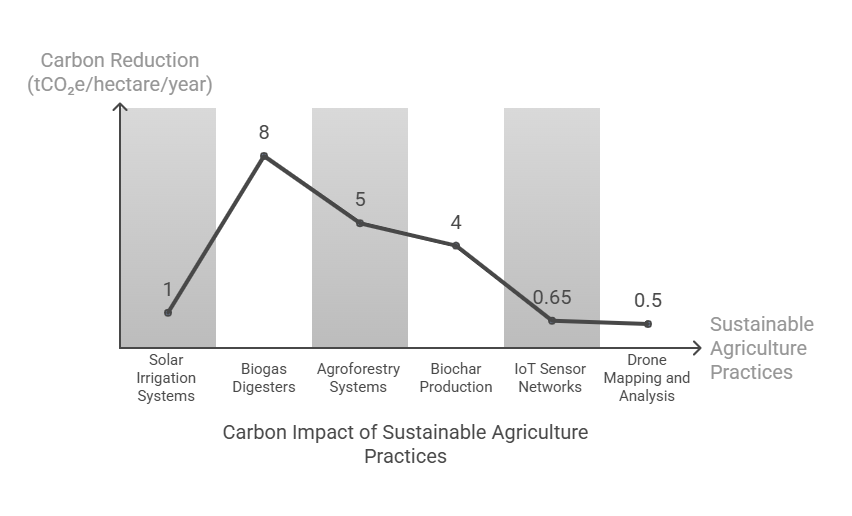
- Carbon impact: 0.8-1.2 tCO₂e reduction per hectare annually
- Financing structure: 20% down payment, 80% financed over 4-6 years
Biogas Digesters
- Implementation cost: $3,000-$15,000
- Average annual savings: $1,200-$5,800 in energy costs
- Carbon impact: 4-12 tCO₂e reduction annually per unit
- Financing structure: Performance-based with partial loan forgiveness tied to methane capture metrics
2. Regenerative Agriculture Practices
Agroforestry Systems
- Average establishment cost: $1,100-$2,400/hectare
- Carbon sequestration: 2-8 tCO₂e/hectare/year after establishment
- Revenue diversification: 35-180% increase over monoculture
- Financing structure: 8-year term with graduated payments aligned to tree maturity
Biochar Production
- Equipment cost: $8,000-$25,000 (community-scale)
- Soil carbon increase: 0.5-2.5% over 3 years
- Yield impact: +15-40% in most crops
- Carbon sequestration: 3-5 tCO₂e/hectare/year
- Financing structure: Equipment lease-to-own with carbon credit sharing
3. Precision Agriculture Technology
IoT Sensor Networks
- Implementation cost: $280-$450/hectare
- Resource efficiency gains: 30-45% reduction in water use
- Carbon impact: 0.5-0.8 tCO₂e/hectare/year indirect reduction
- Financing structure: Technology-as-a-service model with monthly subscription
Drone Mapping and Analysis
- Service cost: $12-$25/hectare/season
- Yield improvement: 8-22% through precise intervention
- Carbon impact: 0.3-0.7 tCO₂e/hectare/year through reduced input use
- Financing structure: Pay-per-scan with seasonal billing
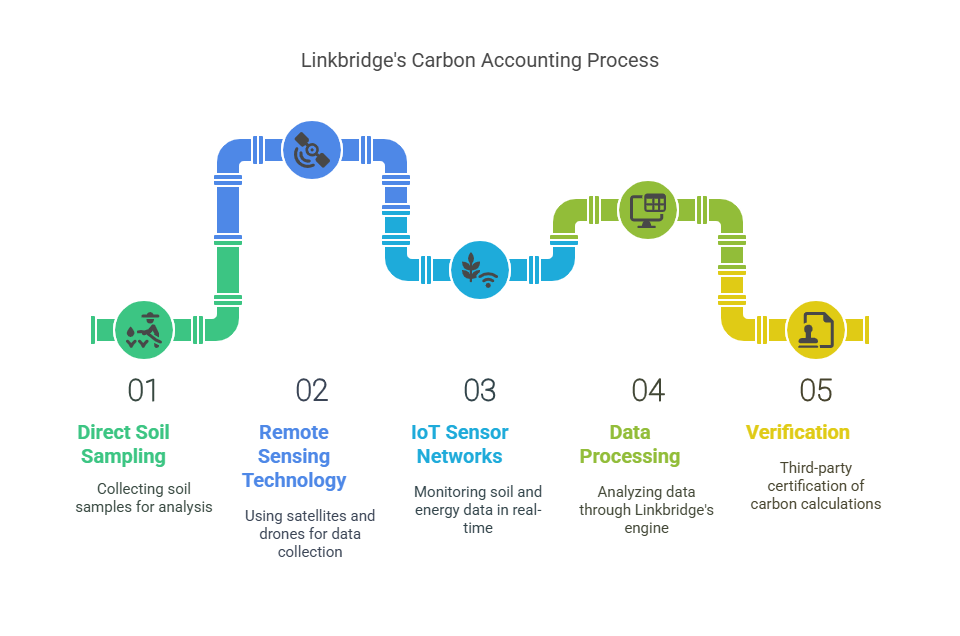
Carbon Measurement and Verification
Linkbridge’s carbon accounting methodology combines:
- Direct soil sampling
- Baseline and annual testing at standardized depths
- Measurement of soil organic carbon, bulk density, and microbial activity
- Remote sensing technology
- Satellite-based vegetative index monitoring
- Drone-based multispectral imagery
- IoT sensor networks
- Real-time monitoring of soil moisture, temperature, and respiration
- Energy consumption tracking across farm operations
This data is processed through Linkbridge’s proprietary carbon calculation engine, which follows IPCC Tier 3 methodologies and is verified by third-party certification bodies.
Investment Returns by Technology Category
Solar Irrigation Systems
- Average Investment: $14,500
- This represents the typical cost for a mid-sized farm to install solar panels, pumping equipment, water storage, and efficient irrigation distribution systems (drip or precision sprinklers).
- The investment includes the solar array (typically 10-15kW), controllers, pumps, and installation labor.
- Payback Period: 3.2 years
- Farmers recover their investment in just over 3 years through:
- Elimination of diesel/electricity costs for pumping (saving $3,000-4,500 annually)
- Increased yields from consistent irrigation (15-25% improvement)
- Reduced crop losses during dry spells
- Farmers recover their investment in just over 3 years through:
- IRR (Internal Rate of Return): 24.8%
- This strong return reflects the significant energy savings and productivity benefits.
- The IRR calculation accounts for system degradation (0.5% annually) and maintenance costs.
- For context, traditional farming investments typically yield 8-12% IRR.
- Carbon Impact: -1.0 tCO₂e/ha/yr
- Each hectare irrigated with solar instead of diesel or grid electricity reduces emissions by 1 ton of CO₂ equivalent annually.
- This comes primarily from avoided fossil fuel use for pumping and reduced fertilizer requirements (as irrigation improves nutrient uptake efficiency).
Biochar Systems
- Average Investment: $16,800
- This covers pyrolysis equipment to convert agricultural waste into biochar, storage facilities, and application machinery.
- Costs include the biochar reactor ($12,000-14,000), material handling equipment, and training.
- Payback Period: 4.5 years
- Longer than solar, but still attractive due to:
- Reduced fertilizer needs (30-50% reduction after 2-3 years)
- Improved water retention reducing irrigation requirements
- Yield increases of 20-40% in most crops
- Carbon credit income
- Longer than solar, but still attractive due to:
- IRR: 18.3%
- Lower than solar but still substantially above traditional farming investments.
- Returns improve over time as soil benefits accumulate and compound.
- Carbon Impact: -4.2 tCO₂e/ha/yr
- The most powerful carbon sequestration technology per hectare in the short term.
- This impressive number comes from:
- Direct carbon storage in soil (biochar is ~80% stable carbon)
- Avoided emissions from agricultural waste burning
- Reduced fertilizer requirements (and associated production emissions)
- Enhanced plant growth capturing additional atmospheric carbon
Agroforestry
- Average Investment: $8,600
- Covers tree seedlings, planting labor, protection systems, and management costs.
- Costs vary by system type (alley cropping, silvopasture, etc.) and tree species.
- Includes 3-4 years of establishment care before full productivity.
- Payback Period: 6.8 years
- The longest payback period due to the time trees need to mature.
- However, the payback improves if early carbon credits are factored in.
- IRR: 15.7%
- Despite the longer time horizon, the IRR remains attractive due to:
- High-value tree products (nuts, fruits, timber)
- Improved field crop yields in agroforestry systems
- Significant carbon credit potential
- System longevity (20+ years of returns)
- Despite the longer time horizon, the IRR remains attractive due to:
- Carbon Impact: -5.8 tCO₂e/ha/yr
- The highest long-term carbon sequestration potential.
- Carbon is stored in:
- Above-ground biomass (trunks, branches)
- Below-ground biomass (roots)
- Increased soil organic matter
- Long-lived wood products (for timber species)
Precision Agriculture Technology
- Average Investment: $5,200
- Covers sensors, software, connectivity equipment, and training.
- Includes soil moisture sensors, weather stations, drone services, and farm management software.
- Payback Period: 2.1 years
- The fastest payback period due to:
- Immediate input optimization (15-30% reduction in fertilizer, water, pesticides)
- Labor efficiency improvements
- Reduced crop losses from better timing of interventions
- The fastest payback period due to:
- IRR: 31.2%
- The highest IRR of all categories reflects:
- Relatively low upfront investment
- Immediate and substantial cost savings
- Yield improvements from precision management
- Minimal maintenance costs
- The highest IRR of all categories reflects:
- Carbon Impact: -0.6 tCO₂e/ha/yr
- While less than other technologies, this is still significant:
- Reduced fertilizer use (and associated production emissions)
- Optimized machinery use (less fuel consumption)
- Prevention of nitrogen volatilization through precise application
- Better residue management through informed decision-making
- While less than other technologies, this is still significant:
Integrated Systems
- Average Investment: $42,300
- Represents farms implementing multiple technologies as a coordinated system.
- This combined approach costs less than the sum of individual technologies due to integration efficiencies.
- Payback Period: 4.3 years
- Represents the weighted average of component technologies.
- Synergies between systems often accelerate returns (e.g., solar powering precision ag sensors).
- IRR: 26.7%
- Higher than the weighted average of component technologies.
- This “integration premium” comes from technology synergies:
- Biochar improving water retention, enhancing solar irrigation efficiency
- Precision ag optimizing biochar and fertilizer application
- Agroforestry creating favorable microclimates for crops
- Carbon Impact: -12.5 tCO₂e/ha/yr
- Greater than the sum of individual technologies due to synergistic effects:
- Enhanced biomass production across all system components
- Optimized resource use reducing emissions from multiple sources
- Cascading benefits throughout the farm ecosystem
- Greater than the sum of individual technologies due to synergistic effects:
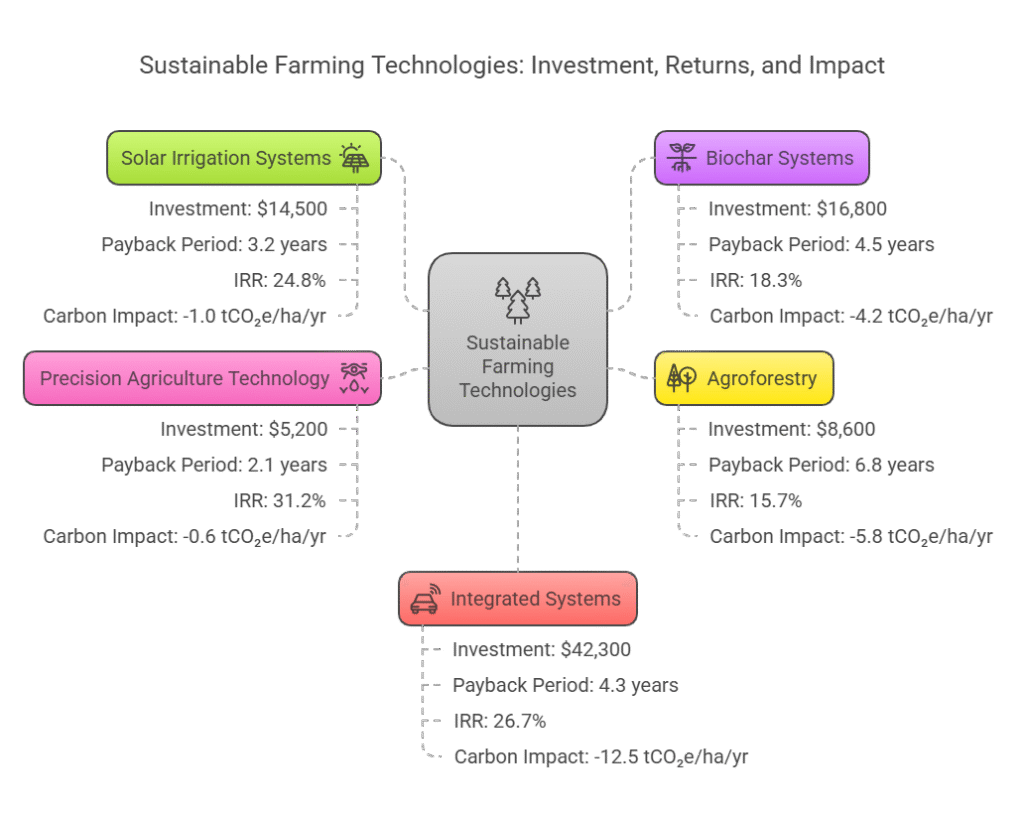
This detailed breakdown shows why Linkbridge prioritizes integrated systems financing when possible, as they deliver both the highest financial returns and carbon impacts. For farms that cannot implement all technologies at once, we use this data to help prioritize which investments will provide the quickest returns based on their specific situation, while creating a pathway to full integration over time.
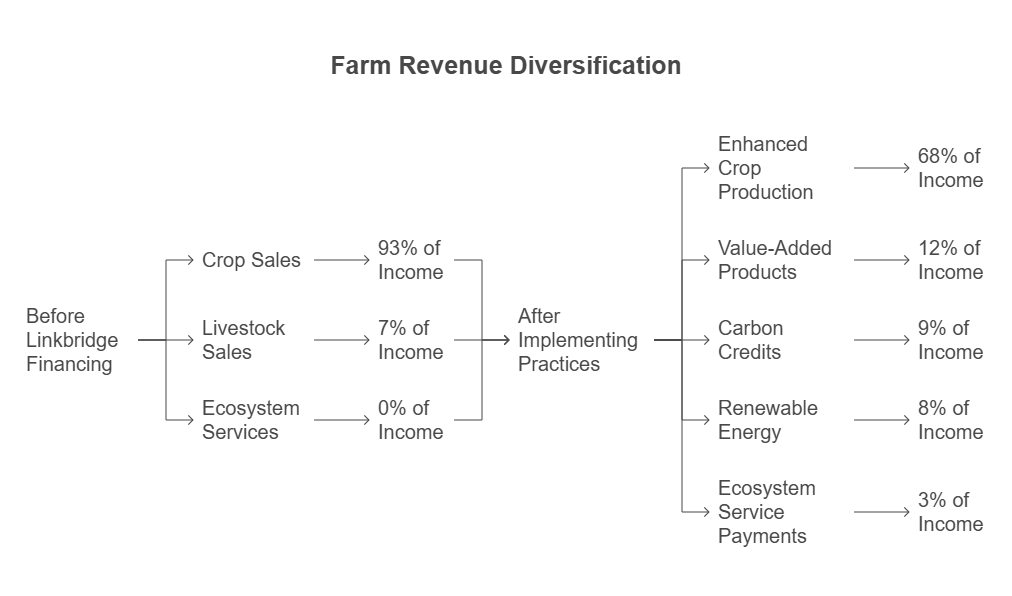
Revenue Diversification Post-Intervention
Before Linkbridge financing, the average farm in our portfolio derived 93% of income from crop sales, 7% from occasional livestock sales, and 0% from ecosystem services.
After implementing carbon-negative practices, the revenue streams diversified:
- 68% from enhanced crop production
- 12% from value-added products
- 9% from carbon credits
- 8% from renewable energy (net metering)
- 3% from ecosystem service payments
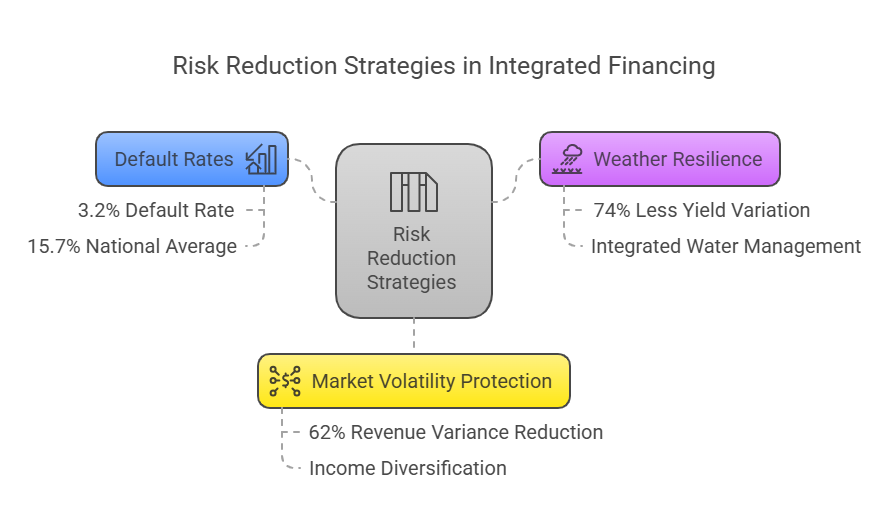
Risk Analysis
Linkbridge’s integrated financing approach has demonstrated significant risk reduction:
- Default rates: 3.2% (compared to 15.7% national average for agricultural loans)
- Weather resilience: Farms with integrated water management showed 74% less yield variation during drought years
- Market volatility protection: Income diversification reduced revenue variance by 62%
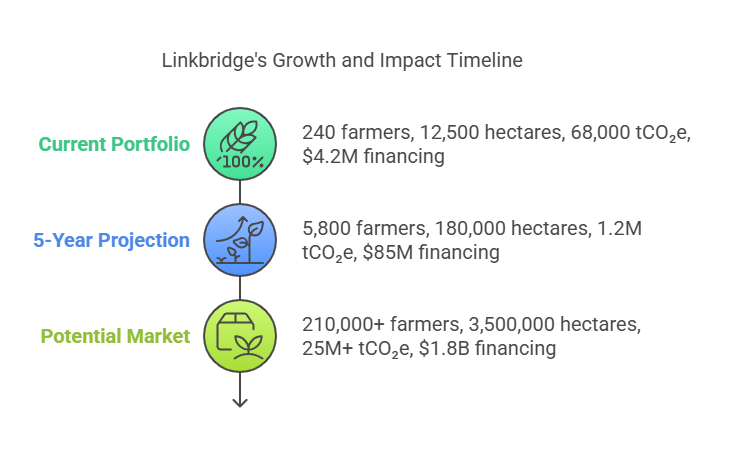
Scaling Potential and Future Outlook
Based on our experience financing carbon-negative transitions for 240+ farms across Zambia, we project the following scaling potential:
Farmers Reached (240 → 5,800 → 210,000+)
Current Portfolio (240 farmers)
- These are the active clients currently implementing carbon-negative practices with Linkbridge financing.
- The portfolio includes:
- 18 medium-sized commercial farms (50-200 hectares)
- 42 agricultural cooperatives (representing about 140 farmers)
- 82 individual smallholder farmers
5-Year Projection (5,800 farmers)
- This represents our ambitious but achievable growth target based on:
- 45% annual growth rate in client acquisition
- Development of streamlined onboarding processes
- Expansion from 3 to 9 Zambian provinces
- Partnerships with 12 agricultural extension service providers
Potential Market (210,000+ farmers)
- This figure represents Zambian farmers who:
- Have secure land tenure (essential for carbon project development)
- Farm at least 2 hectares (minimum viable size for meaningful carbon impact)
- Have baseline farming practices that could transition to carbon-negative
The total number of farmers in Zambia is approximately 1.5 million, but many have plots too small for viable carbon projects or face land tenure issues that would complicate long-term carbon investments.
Hectares Transitioned (12,500 → 180,000 → 3,500,000)
Current Portfolio (12,500 hectares)
- This represents the total land area currently under carbon-negative management through our financing.
- The average farm size in our portfolio is approximately 52 hectares, higher than the national average because our early adopters included more commercial farmers.
5-Year Projection (180,000 hectares)
- This projection reflects:
- The 5,800 farmers we aim to reach
- A gradually decreasing average farm size (to about 31 hectares) as we expand to more smallholders
- More efficient land conversion processes as we refine our methodologies
Potential Market (3,500,000 hectares)
- This represents approximately 45% of Zambia’s 7.75 million hectares of cultivated land.
- Not all agricultural land is included because:
- Some land lacks the necessary baseline data for carbon projects
- Some farming systems (e.g., certain wetland cultivation) present technical challenges for carbon measurement
- We exclude land with high conservation value that should not be converted to agricultural use
Annual Carbon Sequestration (68,000 → 1.2M → 25M+ tCO₂e)
Current Portfolio (68,000 tCO₂e)
- This is the actual measured carbon sequestration from our existing projects, verified by third-party auditors.
- It averages approximately 5.44 tCO₂e per hectare annually, which exceeds global averages for agricultural carbon projects (typically 2-4 tCO₂e/ha).
- Our higher sequestration rates result from our integrated approach combining multiple carbon-negative technologies.
5-Year Projection (1.2M tCO₂e)
- This projection assumes:
- 180,000 hectares under management
- A slightly improved average sequestration rate of 6.67 tCO₂e per hectare as our implementation methodologies mature
- Full verification and certification of all carbon credits
Potential Market (25M+ tCO₂e)
- This estimate is based on:
- 3.5 million potentially convertible hectares
- An average sequestration potential of 7.14 tCO₂e per hectare annually
- The higher per-hectare potential assumes technological improvements and policy support
For context, Zambia’s total national emissions are approximately 74 million tCO₂e annually, so the full market potential would offset about 34% of the country’s emissions—transforming agriculture from an emissions source to a major carbon sink.
Financing Deployed ($4.2M → $85M → $1.8B)
Current Portfolio ($4.2M)
- This represents our total capital deployed to date, including:
- $3.1M in direct equipment and technology financing
- $750,000 in working capital loans
- $350,000 in technical assistance grants
5-Year Projection ($85M)
- This financing target includes:
- $65M in direct project financing
- $12M in carbon pre-financing
- $8M in technical assistance
The average investment per farm decreases from our current $17,500 to approximately $14,655 per farm as we achieve economies of scale and optimize our financing models.
Potential Market ($1.8B)
- This market size estimate assumes:
- An average investment of $8,500 per farm (decreasing as technology costs fall)
- Full market penetration of 210,000+ farms
- Integration with national climate finance mechanisms
This $1.8B represents approximately 6.5% of Zambia’s GDP, highlighting the significant economic opportunity in the agricultural carbon transition.
Implementation Strategy
To achieve this ambitious scaling, Linkbridge is pursuing a three-pronged approach:
- Geographic expansion – Moving from our current operations in Southern, Eastern, and Lusaka provinces to cover all nine Zambian provinces by 2027
- Financing innovation – Developing new financial products including:
- Carbon offtake agreements to reduce upfront costs
- Equipment leasing programs with flexible terms
- Results-based financing tied to verified carbon outcomes
- Technology partnerships – Collaborating with agricultural technology providers to reduce costs and improve measurement accuracy:
- Satellite-based monitoring to reduce verification costs
- AI-powered advisory services to improve implementation
- Mobile payment integration for carbon revenues
The projected impact goes beyond carbon sequestration, potentially:
- Creating 45,000+ green jobs in rural areas
- Improving resilience for over 29,000 farming households
- Generating $180M+ in additional annual agricultural income
These growth projections demonstrate both the environmental imperative and economic opportunity in scaling carbon-negative agriculture across Zambia.
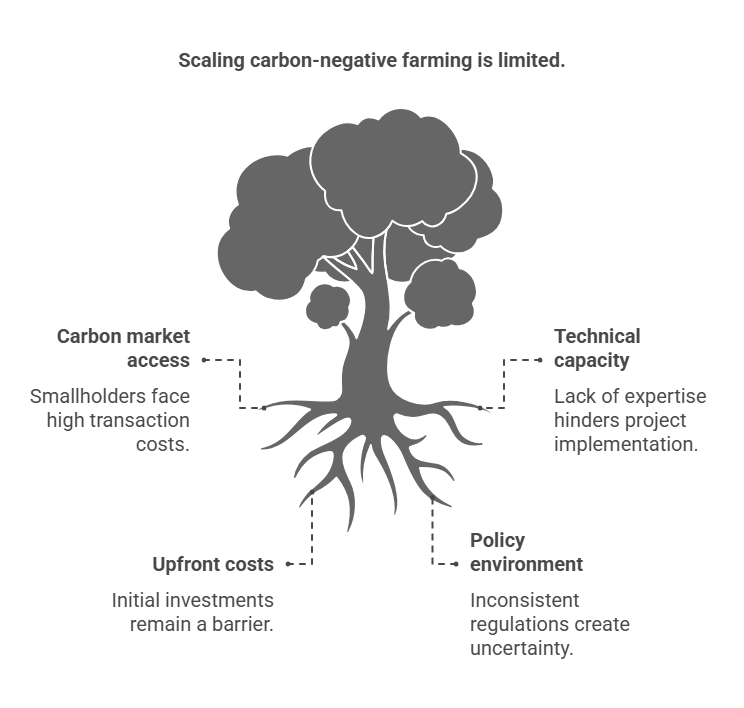
Barriers to Scale
- Carbon market access: Limited direct market access for smallholders increases transaction costs
- Technical capacity: Need for trained professionals to implement and monitor carbon projects
- Upfront costs: Even with financing, initial capital requirements can be prohibitive
- Policy environment: Inconsistent regulatory frameworks for carbon markets and renewable energy
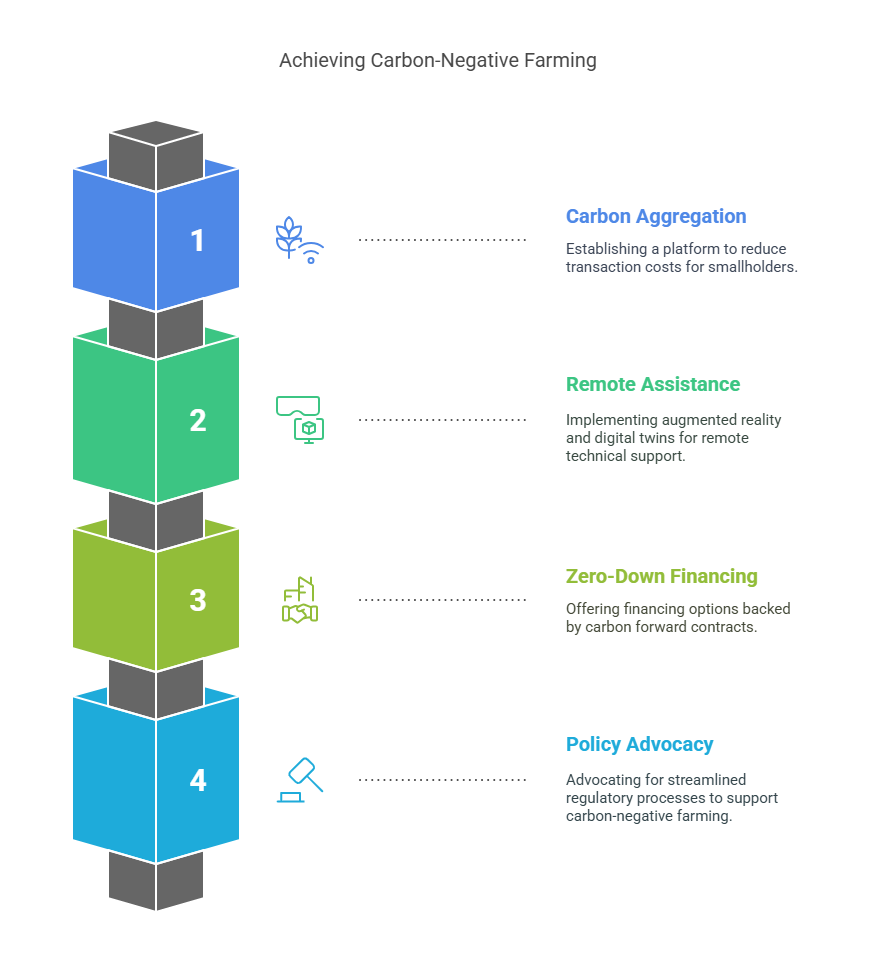
Innovation Roadmap
To address these challenges, Linkbridge is developing:
- Carbon aggregation platform to reduce transaction costs for smallholders
- Remote technical assistance model using augmented reality and digital twins
- Zero-down financing options backed by carbon forward contracts
- Policy advocacy initiative to streamline regulatory processes
Conclusion
Linkbridge’s financing model demonstrates that the transition to carbon-negative agriculture is not only environmentally necessary but economically viable. By integrating renewable energy, regenerative practices, and smart technology with innovative financing structures, farms can become significant carbon sinks while improving livelihoods and food security.
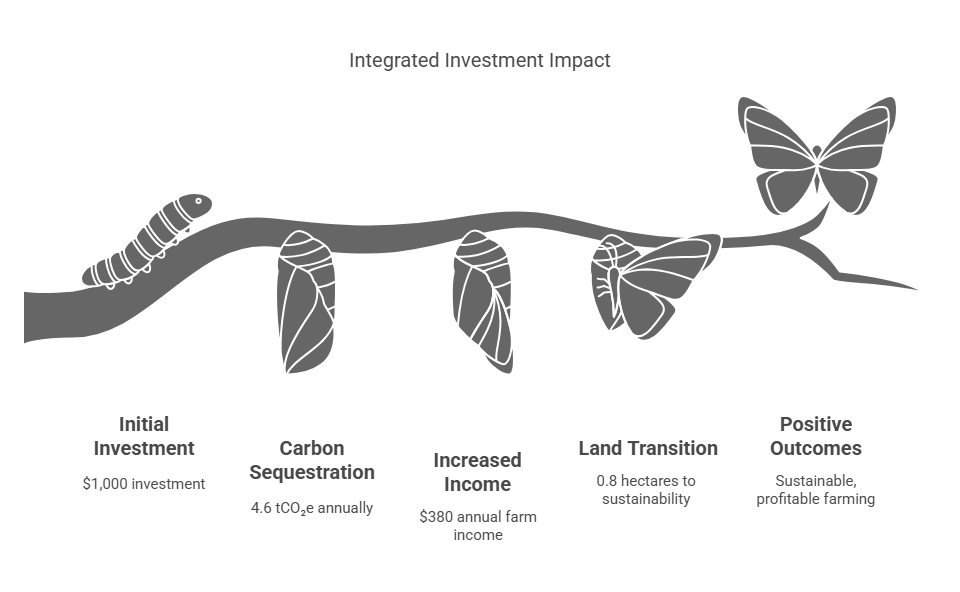
Our data shows that every $1,000 invested in this integrated approach yields:
- 4.6 tCO₂e of annual carbon sequestration
- $380 in increased annual farm income
- 0.8 hectares of land transitioned to sustainable management
With targeted financing and supportive policies, Zambian agriculture can be transformed from a carbon source to a significant carbon sink, creating a model for climate-smart agricultural development across Africa.